How CODE 118 Transformed Their Email Channel Into a 7-Figure Powerhouse in One Month
Brand: CODE 118
Niche: Everyday Carry (EDC) Essentials
Service: Email and SMS
The Brand
CODE 118 was created to redefine everyday carry. Inspired by the 118 elements of the periodic table, the brand designs high-performance essentials made with carbon fiber, aerospace aluminum, and titanium. These products serve creators, adventurers, and problem-solvers who want minimalist, durable, premium gear without luxury markups.
The Results (Nov 1 to Nov 30, 2025)
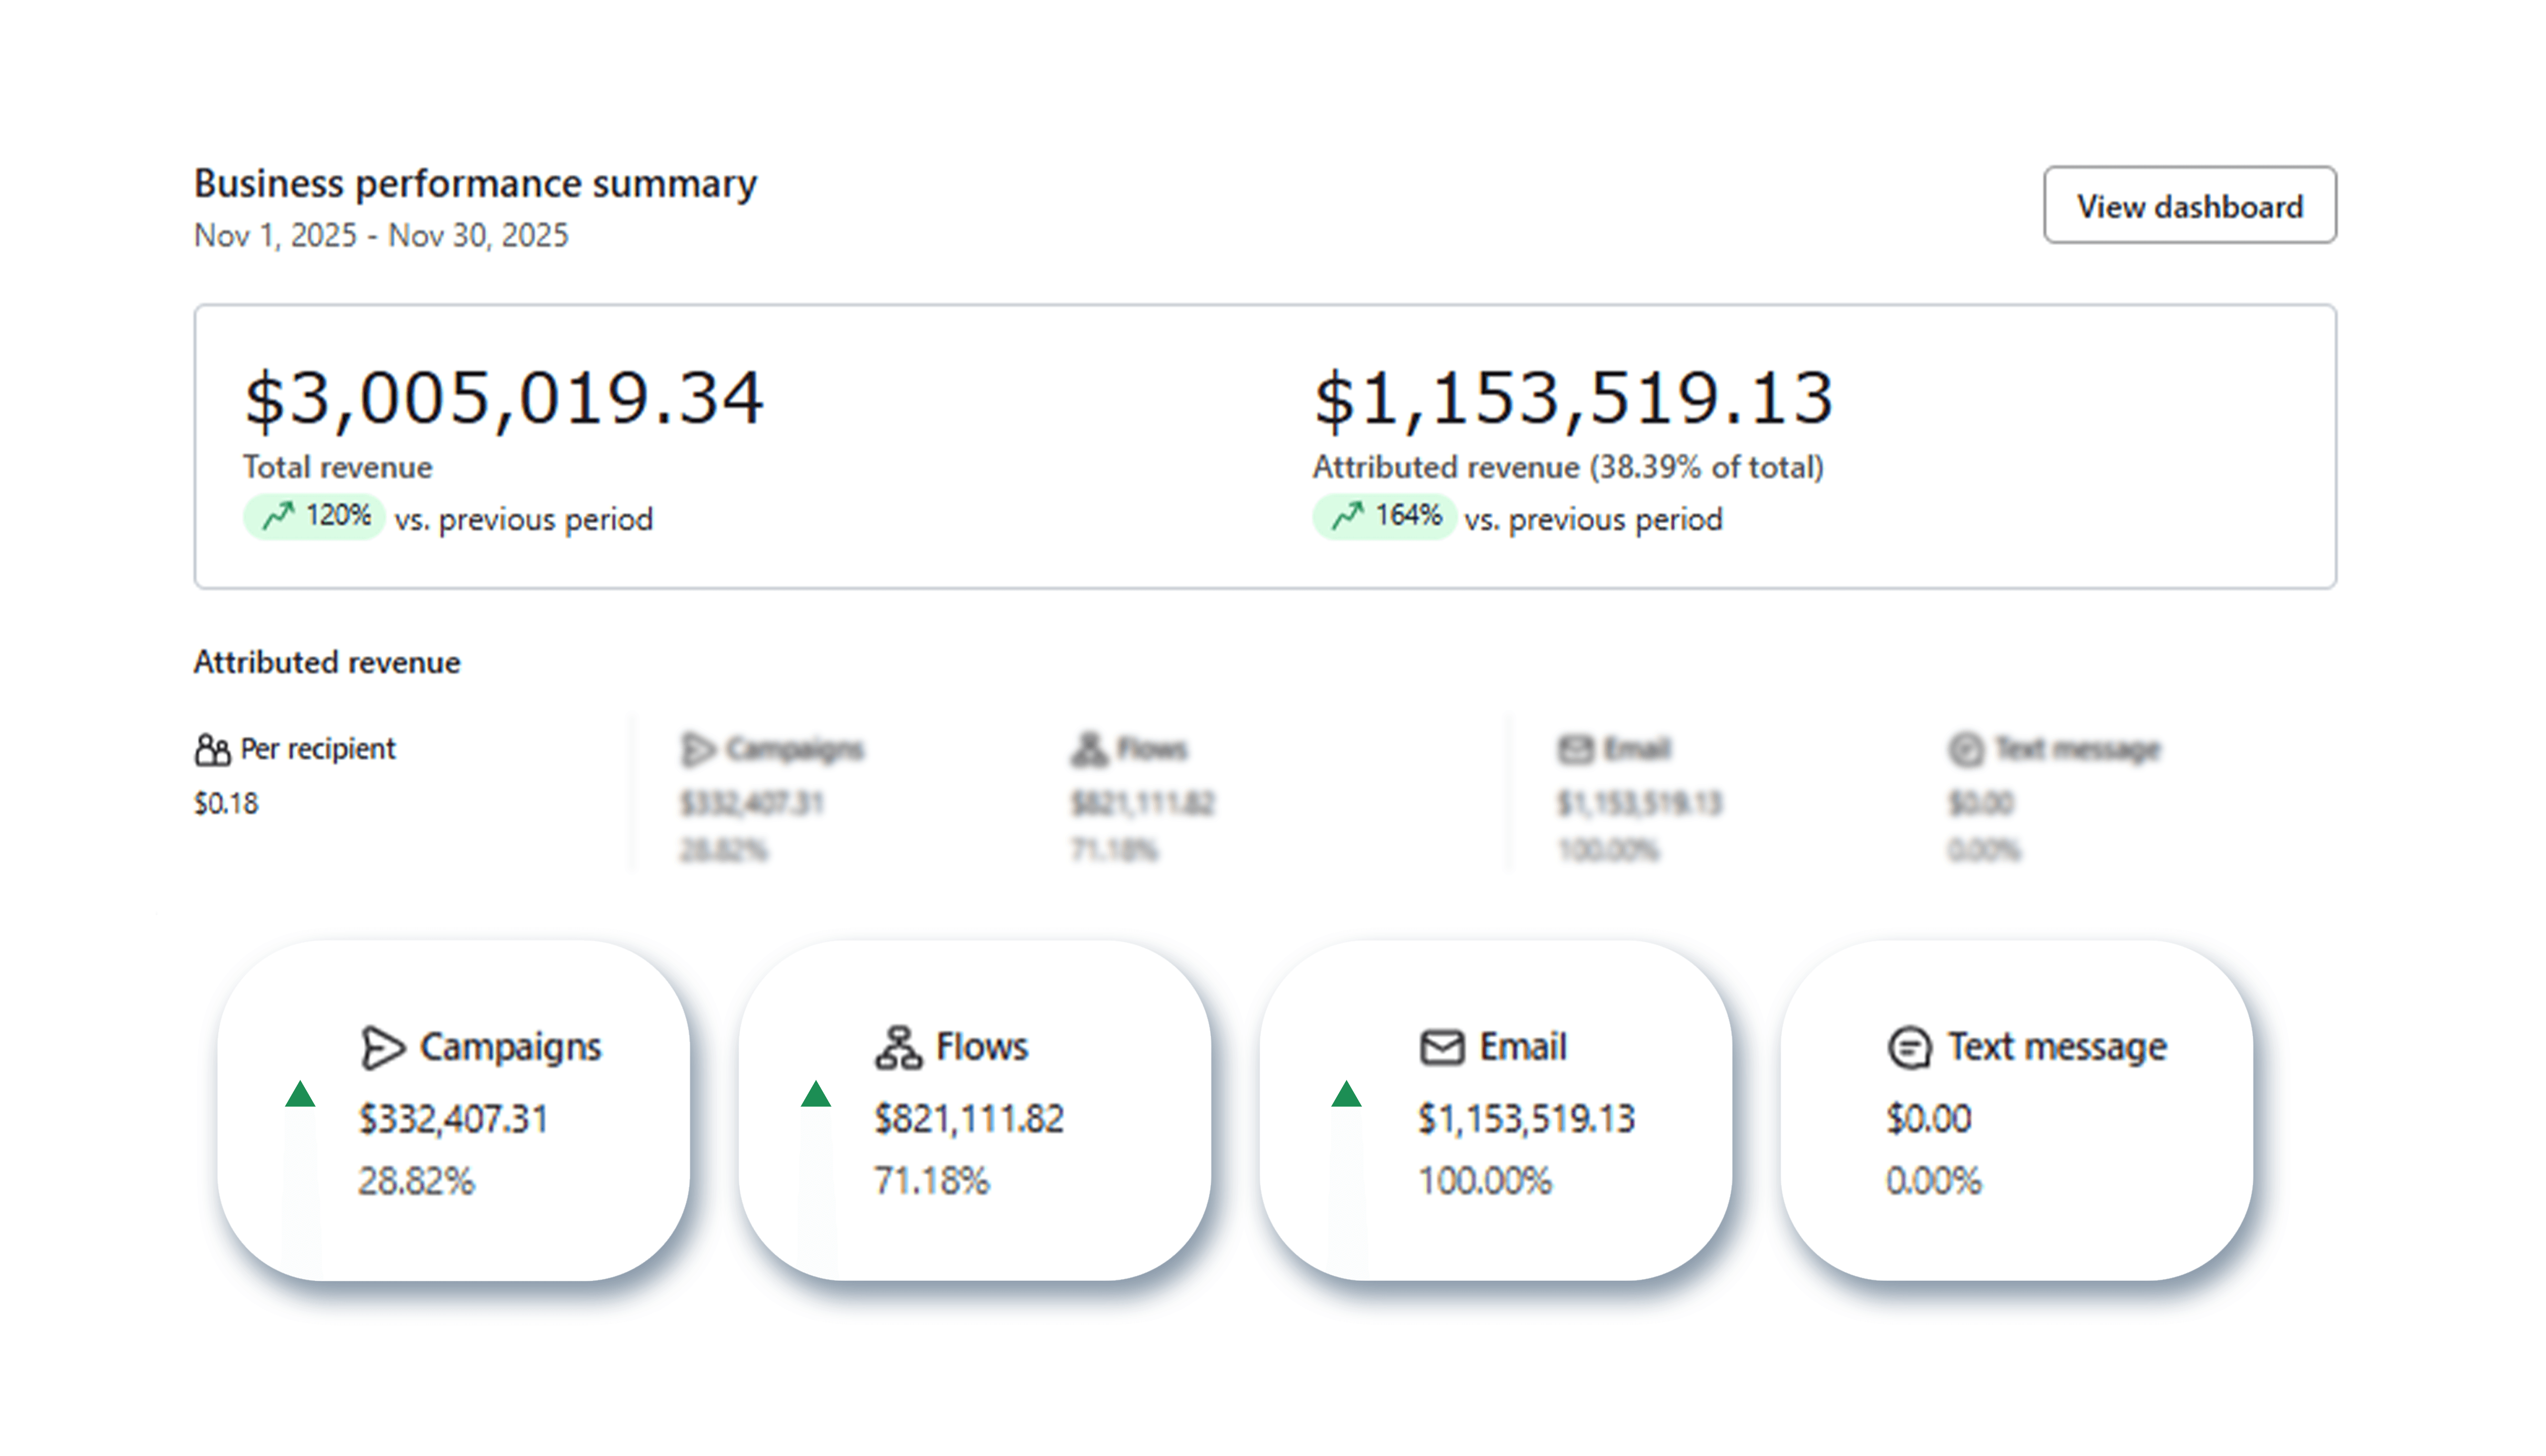
In 30 days, the optimized email system generated:
Attributed revenue: $1,153,519.13
Growth vs previous period: +164%
Email contribution to attributed revenue: 100%
Flow revenue: $821,111.82 (71.18%)
Campaign revenue: $332,407.31 (28.82%)
Revenue per recipient: $0.18
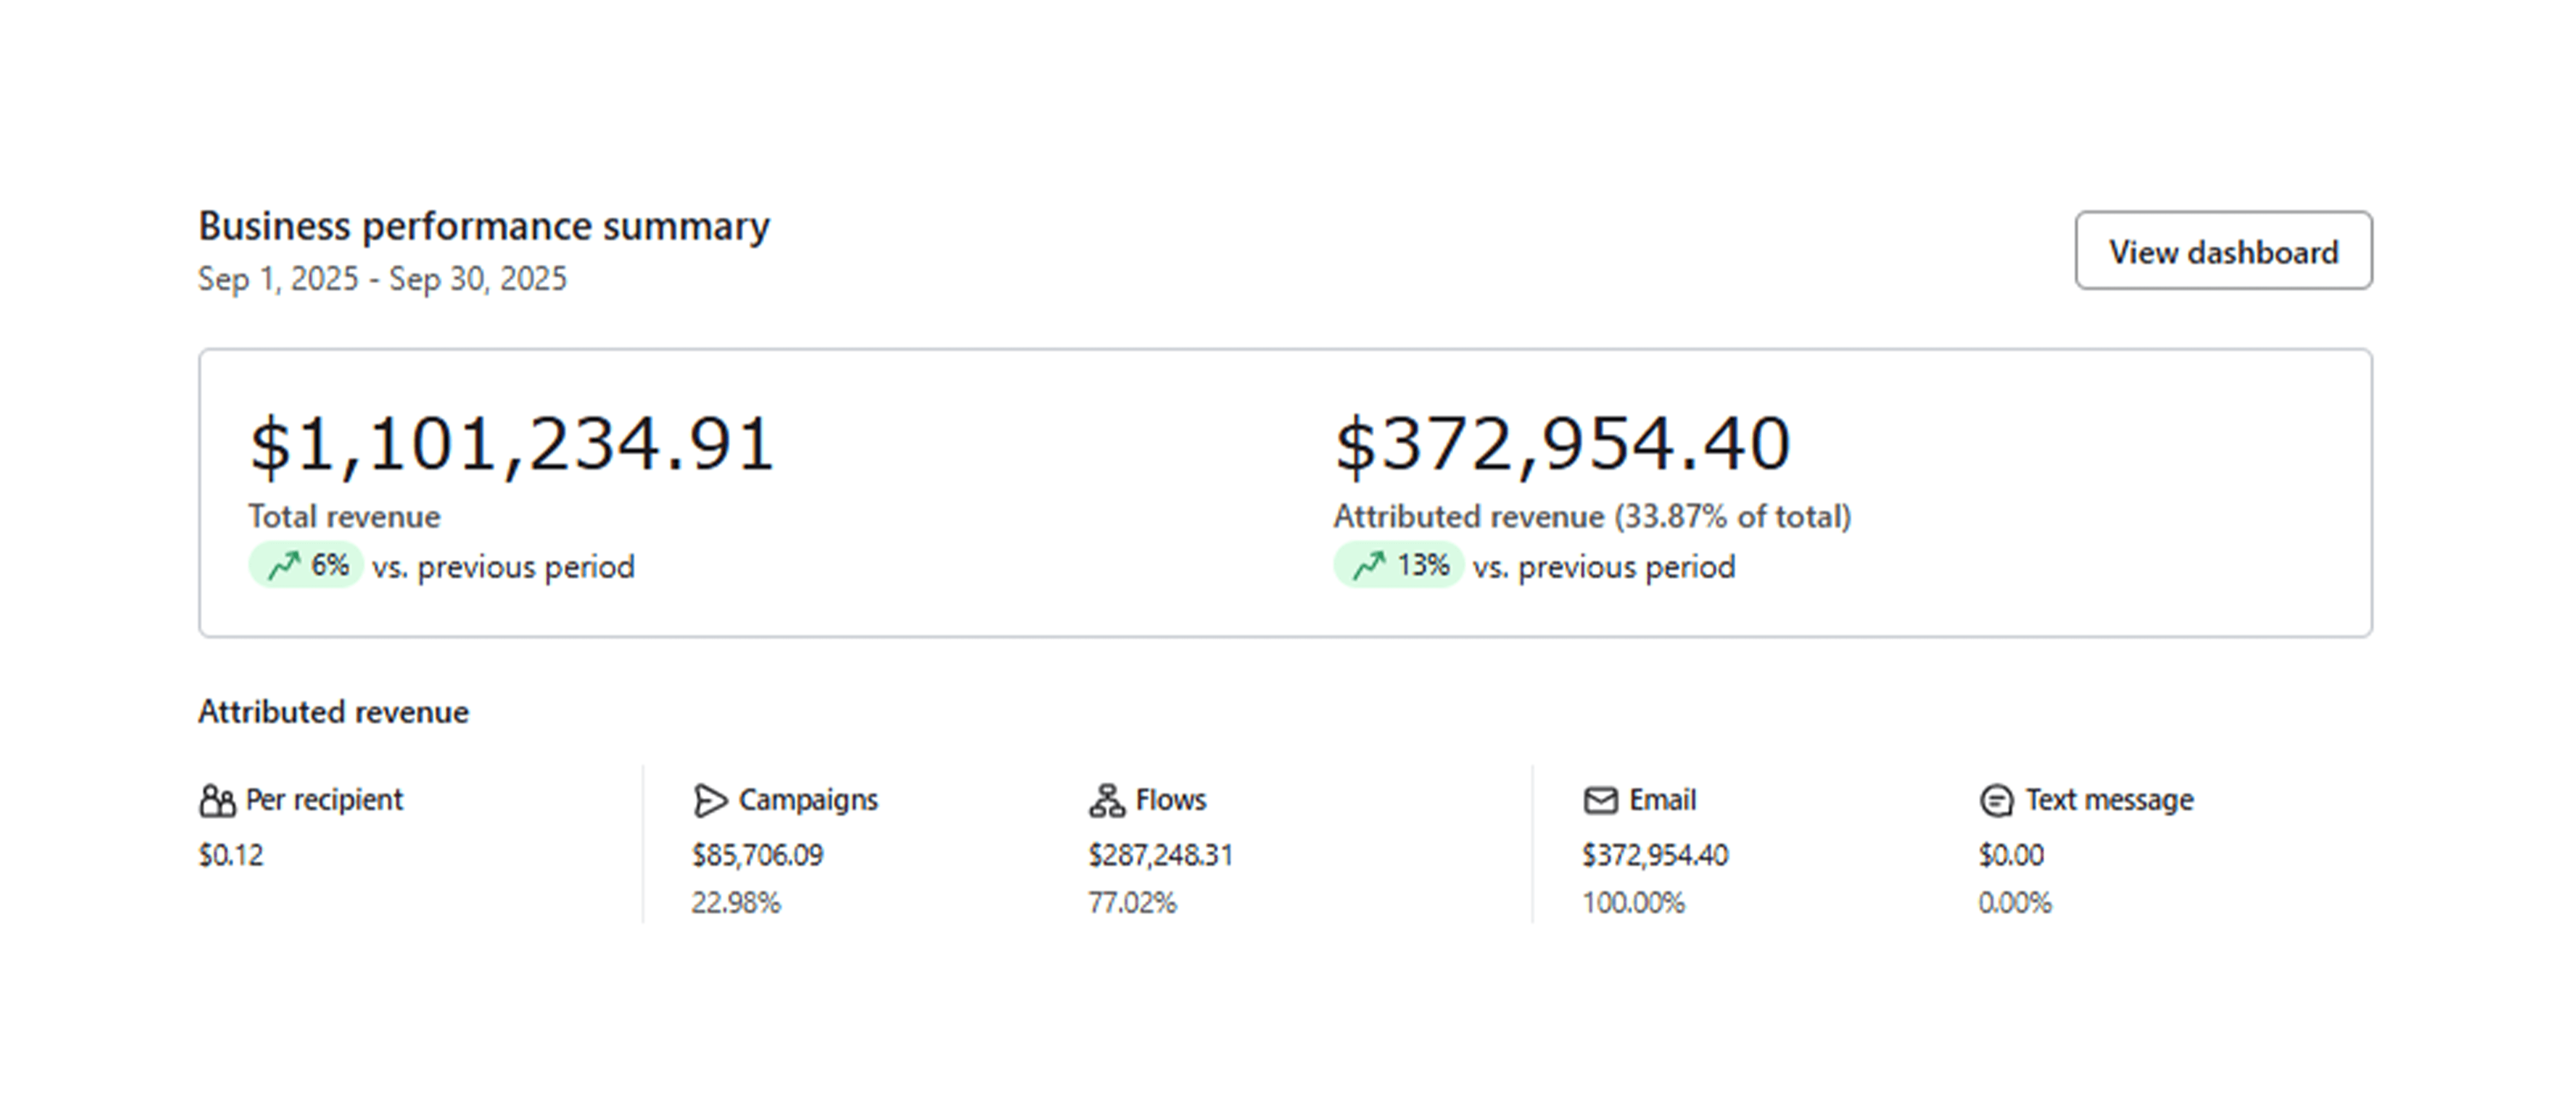
Baseline
September attributed email revenue: $372,954.40
November attributed revenue: $1,153,519.13
Growth: +164% in 60 days
The Challenge
Before the rebuild, CODE 118 experienced:
No consistent email schedule
Weak segmentation that reduced deliverability
Underperforming flows
Low urgency in campaigns
Unpredictable engagement
Heavy reliance on promotions without lifecycle support
Our Strategy
We created a structured, high-intent lifecycle program focused on consistency, segmentation, and purchase behavior.
1. Predictable Sending Rhythm
A clear sequence was introduced for Black Friday and holiday campaigns.
This included launch messages, reminders, last-call sends, plain text moments, and educational content.
2. Segmentation Based on Intent
Audiences were separated by:
Activity windows
Click behavior
Purchase history
Product interest
This improved inbox placement and performance.
3. High-Clarity Subject Lines
Subject lines were short and value-focused, which produced consistent open rates above 70%.
4. Full Lifecycle Rebuild
We improved or rebuilt:
Welcome
Add to Cart
Cart Abandon
Checkout Abandon
Browse Abandon
Site Abandon
Post Purchase Bounce Back
Winback
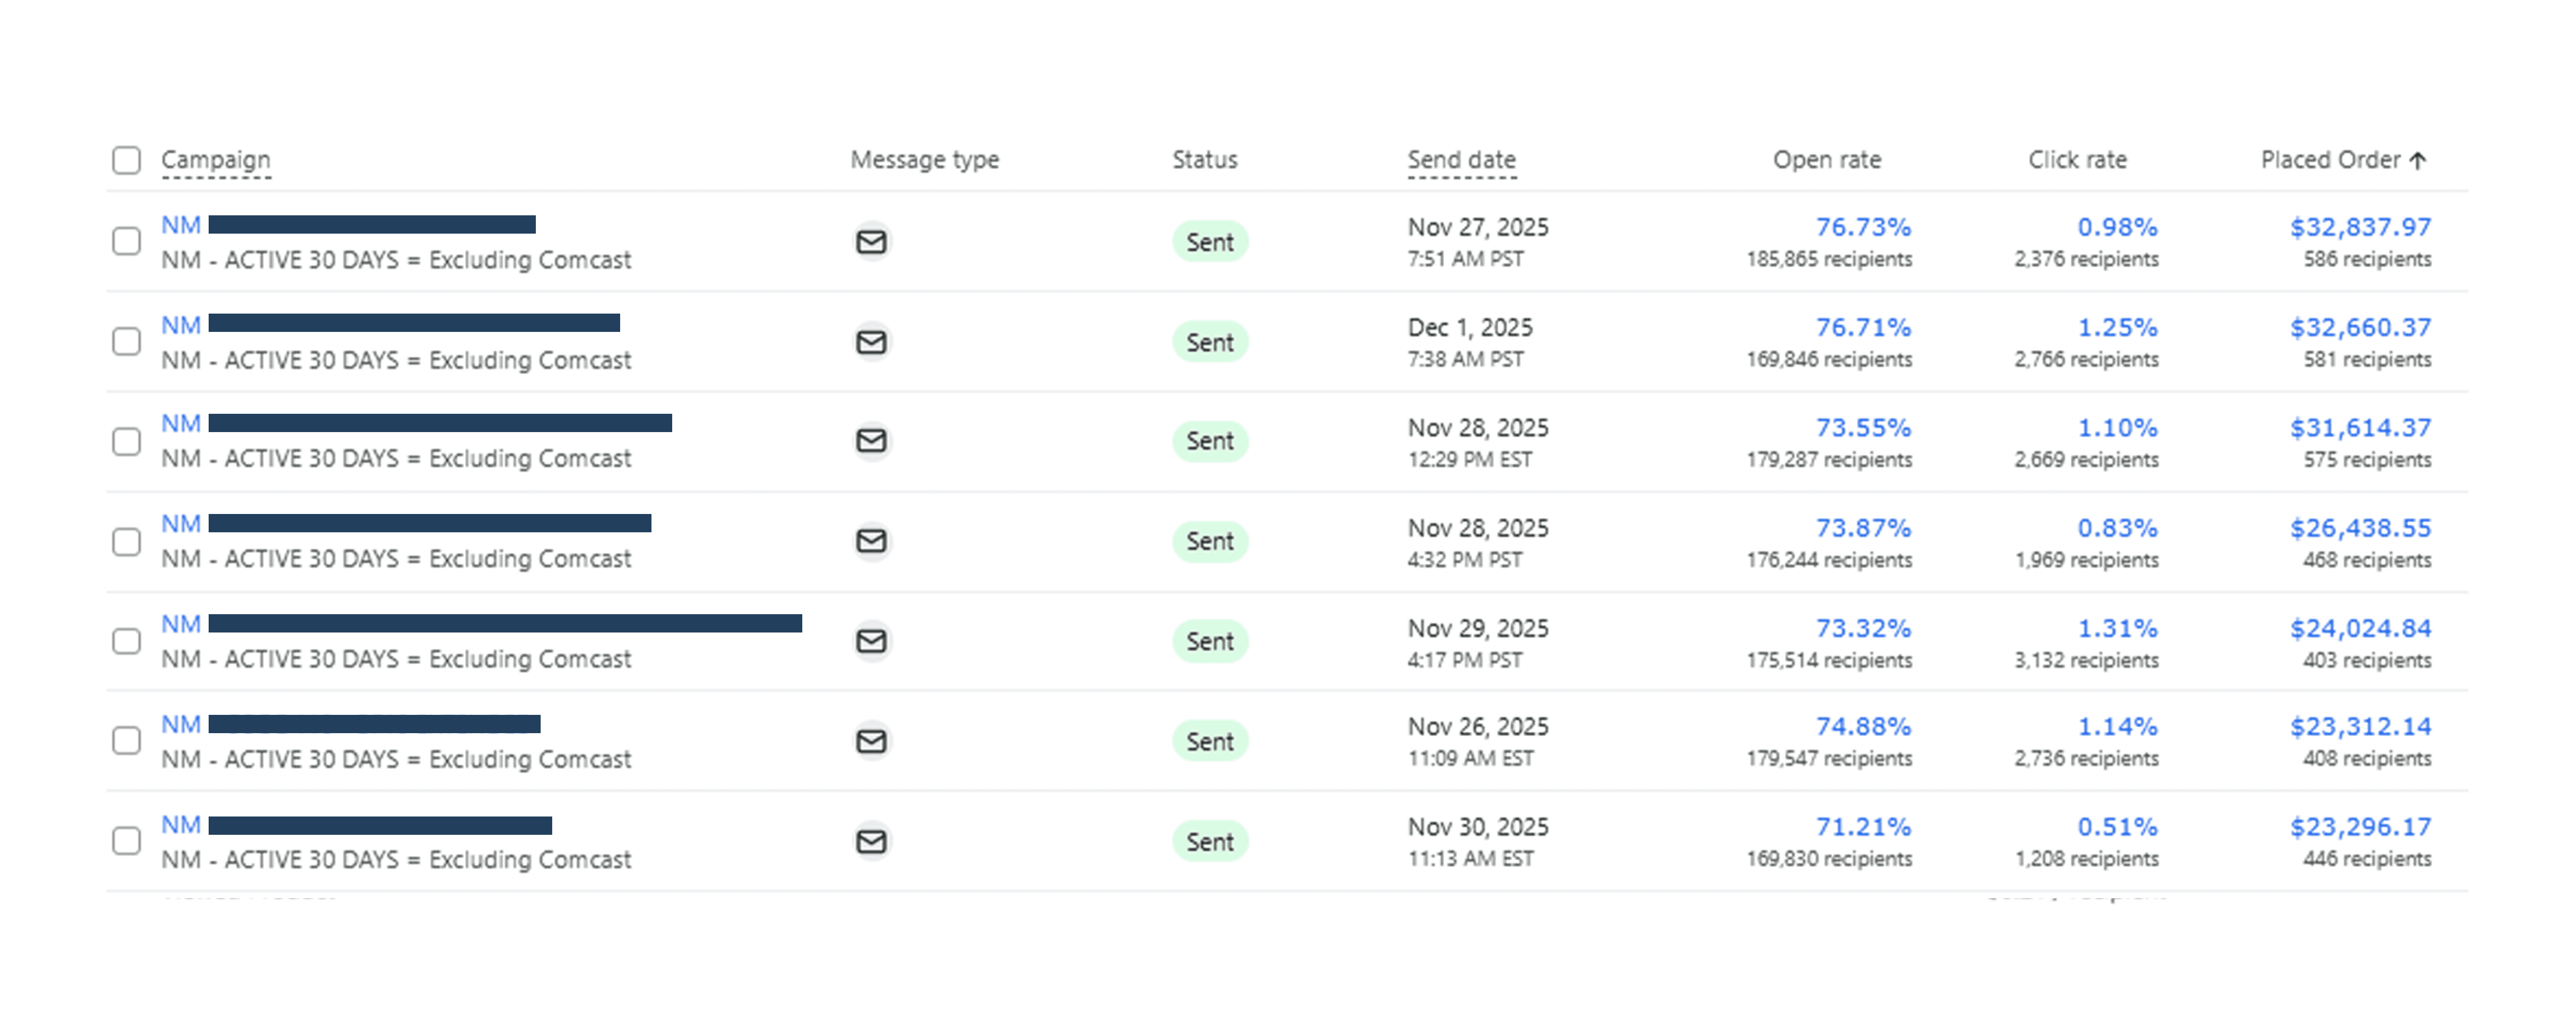
Campaign Performance
(7 Emails Sent)
Across seven campaigns:
Average open rate: 74.11%
Average click rate: 0.99%
Revenue per recipient range: $0.06 – $0.18
# | Open Rate | Click Rate | Revenue | RPR |
|---|---|---|---|---|
1 | 76.73% | 0.98% | $32,837.97 | $0.18 |
2 | 76.71% | 1.25% | $32,660.37 | $0.19 |
3 | 73.55% | 1.10% | $31,614.37 | $0.18 |
4 | 73.87% | 0.83% | $26,438.55 | $0.15 |
5 | 73.32% | 1.31% | $24,024.84 | $0.14 |
6 | 74.88% | 1.14% | $23,312.14 | $0.13 |
7 | 71.21% | 0.51% | $23,296.17 | $0.14 |
Key Insights
Highest open rate: #1 at 76.73%
Highest click rate: #2 at 1.25%
Highest revenue per recipient (RPR): #2 at $0.19
Flow Performance
Flows produced:
Total flow revenue: $698,595.15
Share of attributed revenue: (calculated once total revenue is provided)
# | Deliveries | Revenue | RPR |
|---|---|---|---|
1 | 494,471 | $254,501.13 | $0.51 |
2 | 342,028 | $189,309.99 | $0.55 |
3 | 313,118 | $114,222.11 | $0.36 |
4 | 49,102 | $80,593.16 | $1.64 |
5 | 222,330 | $59,968.76 | $0.27 |
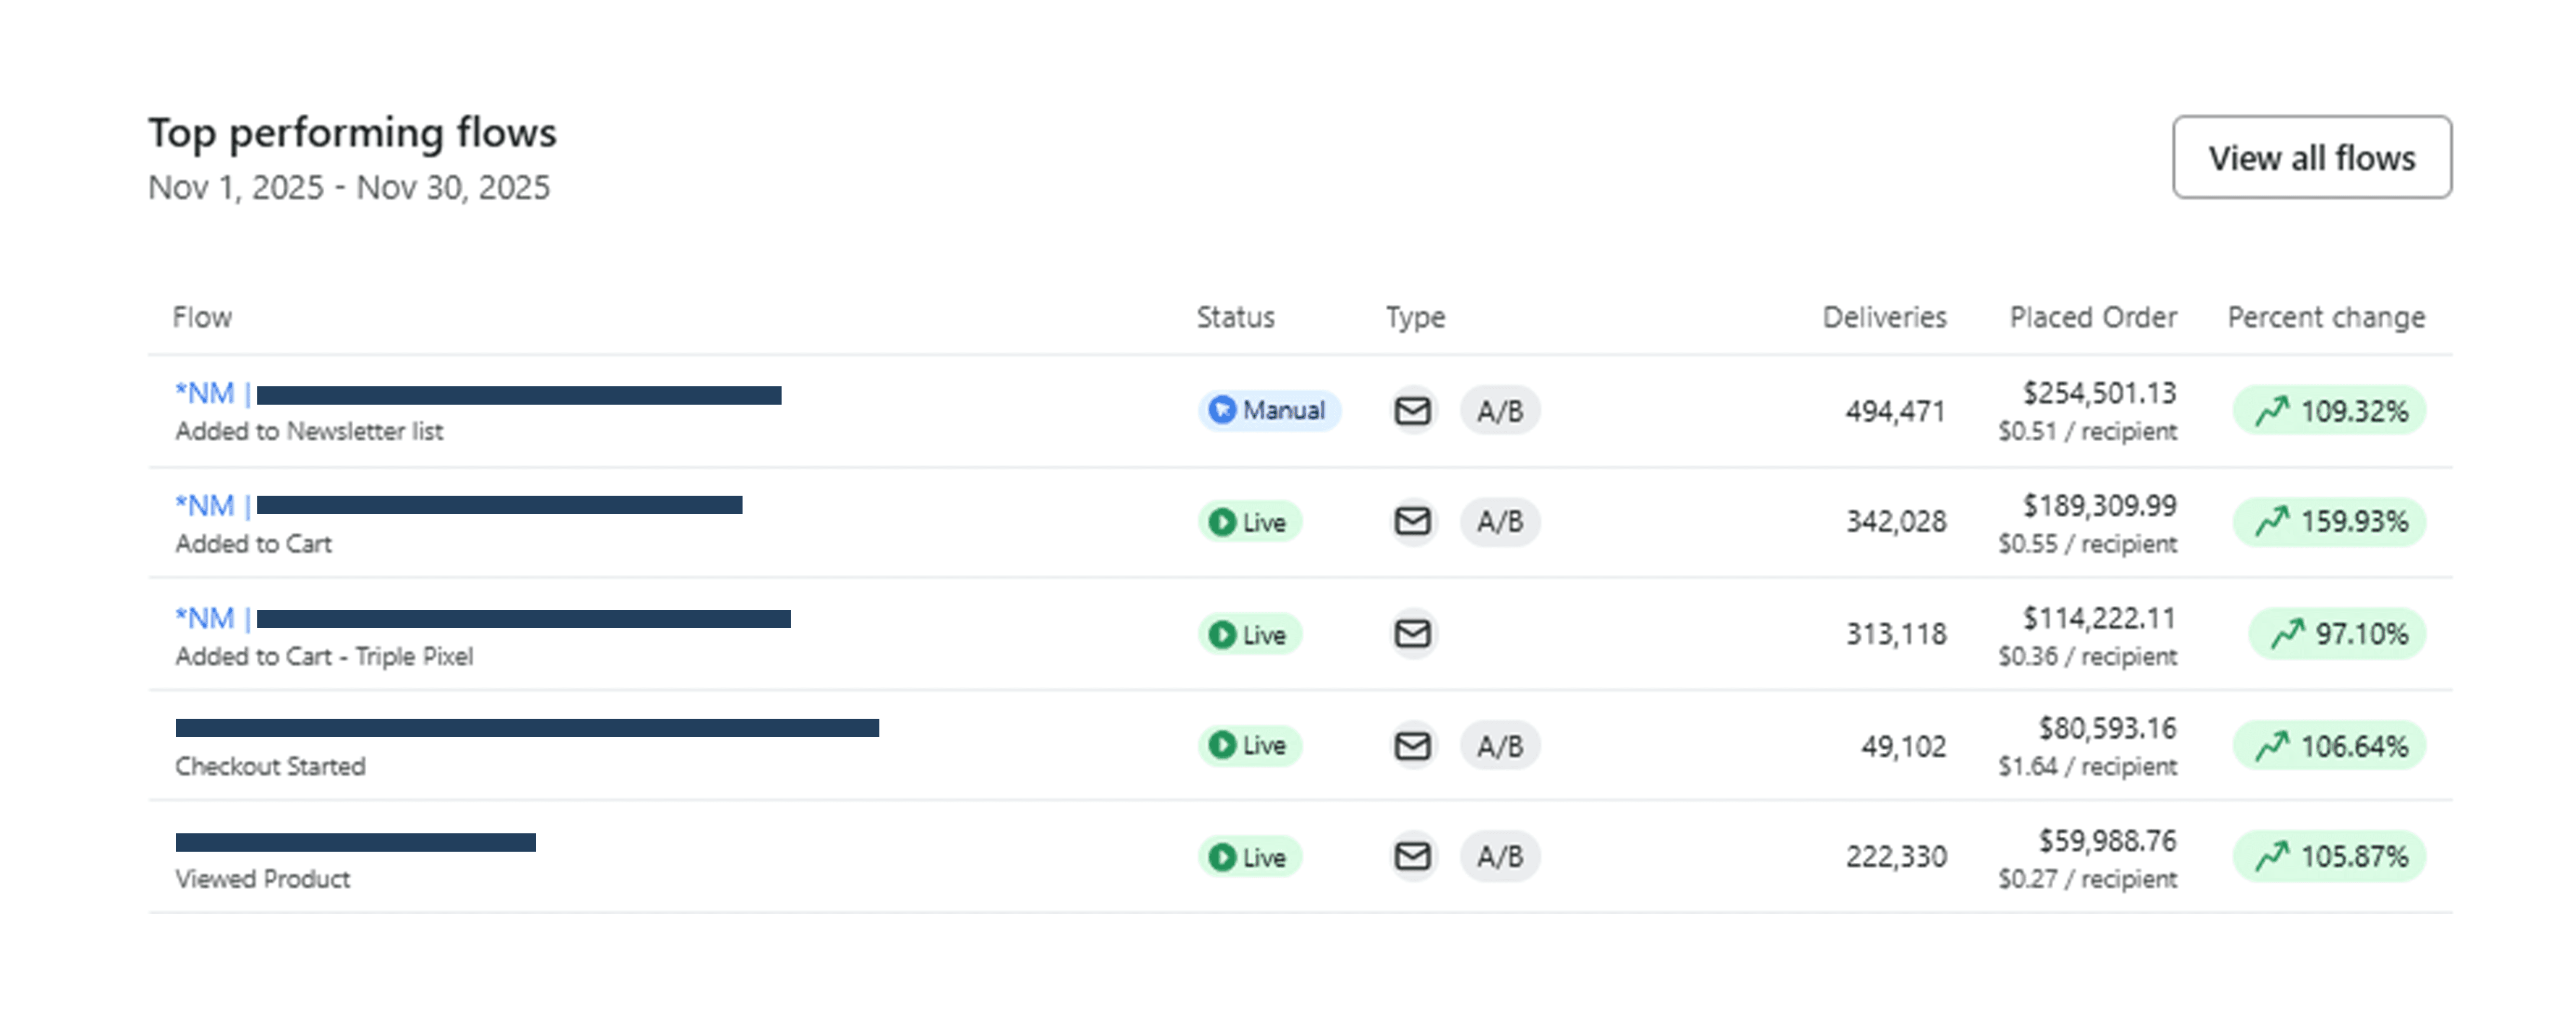
Why These Flows Performed
High-intent touchpoints (Added to Cart, Checkout Started, Viewed Product) captured users closest to purchase
Strong segmentation + behavioral triggers delivered messages at the right moment
A/B testing improved performance on top-of-funnel entries
Checkout Started (#4) generated $1.64 per recipient, making it the strongest individual touchpoint across all flows
Why This System Worked
A consistent cadence improved open behavior
Targeted segmentation protected deliverability
Clear value messaging increased clicks
A strong mix of plain text and branded designs helped inbox placement
Lifecycle flows captured intent throughout the customer journey
The result was a predictable system rather than a single promotional spike.